News
TriStar Gold Announces Positive PFS with 1.4 Moz Gold Reserves and Pre-Tax 33% IRR and $400 Million NPV
October 5, 2021
- After-tax NPV5% of US$321 million at $1,550 base-case gold price
- A compelling after-tax IRR of 28% for a large scale, development asset in a mining-friendly mining jurisdiction
- Phase 1: average annual gold production of 146,000 ounces
- Phase 2: average annual gold production of 91,000 ounces
- LOM: average annual gold production of 121,000 ounces
- AISC of US$900/oz
- After-tax payback period of less than 3 years
Scottsdale, Arizona--(Newsfile Corp. - October 5, 2021) - On behalf of TriStar Gold Inc. (TSXV: TSG) (OTCQX: TSGZF) (the "Company" or "TriStar"), GE21 Consultoria Mineral Ltda ("GE21") of Belo Horizonte, Brazil, and Piteau Associates of Sandton, South Africa have completed the prefeasibility study ("PFS") for the Company's Castelo de Sonhos gold project in southern Pará State, Brazil, which includes an updated mineral resource estimate.
Nick Appleyard, TriStar's President and CEO, stated: "The prefeasibility study is a major step forward in de-risking and advancing this compelling project. Mineral resources continue to grow, and we now have a very significant 1.4 million ounces in probable reserves. Additionally, the study indicates low costs from a simple operation that results in anticipated payback in less than 3 years and an average Phase 1 production rate of about 150,000 ounces per year. This project has once again exceeded our expectations, with 20% more gold production than was projected by our 2018 Preliminary Economic Assessment".
The results of the PFS now replace the 2018 PEA, originally announced in the Company's press release dated November 16, 2018. The PFS has incorporated several positive changes in the approach to the planned development of Castelo de Sonhos compared with the 2018 PEA. The scope and other changes incorporated in the PFS include:
Increased throughput: Plant capacity has increased 21% from the PEA up to 10,000 tonnes per day or 3.6 million tonnes per year.
Phased mining: Mining operations will be conducted in 2 distinct phases:
Phase 1 is years 1 to 6 of operations and is 100% focused on mining the higher grade Esperança South deposit.
Phase 2 is from year 7 to 11 and involves mining Esperança East and Center deposits.
Owner operator mining: With the expanded operation and higher throughput, owning and operating our own mine fleet is economically favorable compared to contract mining.
An Environment, Social Governance ("ESG") commitment: a significant commitment to ongoing environmental and social stewardship, LOM spending in excess of US$20 million.
Compelling economics notwithstanding the current inflationary pressures: the initial capital costs have increased from US$184 million in the 2018 PEA to US$261 million in the PFS. The main components to this change in capex are:
- 21% increase in plant capacity
- Inclusion of an owner operated mining fleet
- Global market escalation, which may include short-term covid driven cost escalation factors that will correct when the pandemic abates.
The Prefeasibility Study
The prefeasibility study was conducted by GE21 Consultoria Mineral Ltda ("GE21") of Belo Horizonte, Brazil, and Piteau Associates of Sandton, South Africa, both of whom are independent of TriStar.
Key highlights of the PFS include:
- Life-of-mine gold production of 1.3 million ounces
- LOM average production of 121k oz per year in two phases:
- Phase 1 (Esperança South, year 1-6) average production - 146k oz per year
- Phase 2 (Esperança East and Center, year 7-11) average production - 91k oz per year
- Cash cost of $877 per ounce
- All in sustaining cost of $900 per ounce
- After-tax payback period of less than 3 Years
- Internal rate of return pre-tax of 33%, post-tax 28%
Annual Gold production and AISC over the life of mine is presented in Table 1.
| PERIOD | AVERAGE ANNUAL GOLD PRODUCTION | CASH COST US$/OZ | AISC US$/OZ |
| PHASE 1 (YEAR 1 - 6) | 146,000 | $821 | $854 |
| PHASE 2 (YEAR 7 - 11) | 91,000 | $983 | $990 |
| LOM | 121,000 | $877 | $900 |
Table 1, Average annual gold production, cash cost and AISC
The base case economics are calculated on a long-term gold price of US$1,550/oz, and a foreign exchange rate of US$1 = BRL5.0. The economics include the effect of the project royalties, including NSR royalties totaling 3.5% and Brazilian federal gross royalty of 1.5%.
The figures and tables below show the sensitivity of pre-tax NPV and IRR to changes in the US dollar gold price.
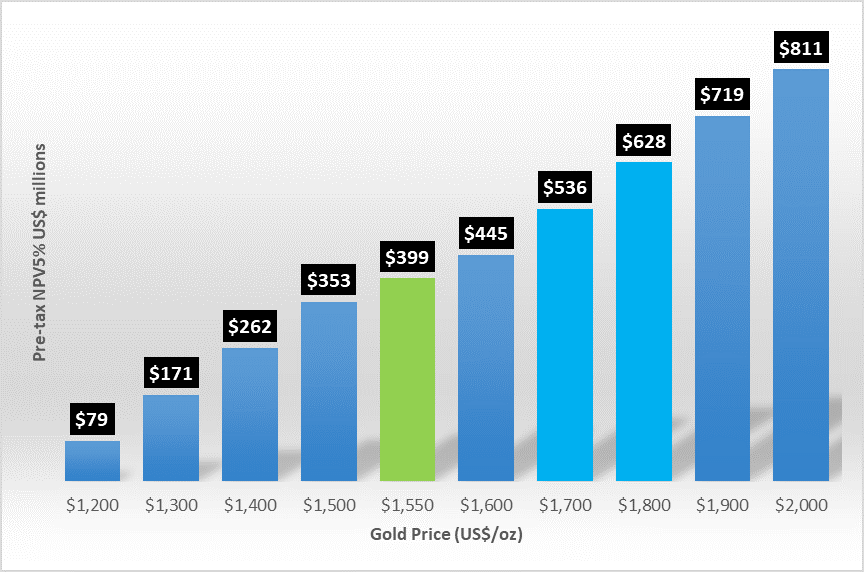
Figure 1, Sensitivity of pre-tax NPV5% (Millions) to gold price, base case highlighted in green, spot price bracketed in teal.
To view an enhanced version of Figure 1, please visit:
https://orders.newsfilecorp.com/files/4509/98543_fig1.png

Figure 2, Sensitivity of pre-tax IRR% to gold price, base case highlighted in green, spot price bracketed in teal blue.
To view an enhanced version of Figure 2, please visit:
https://orders.newsfilecorp.com/files/4509/98543_fig2.png
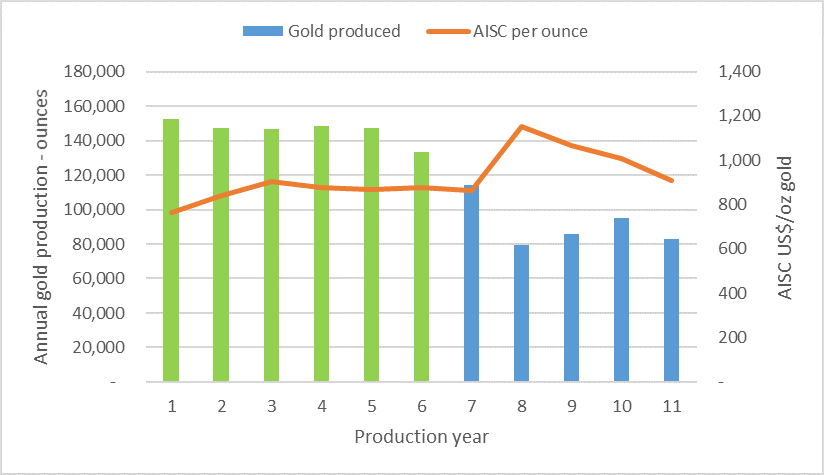
Figure 3, Gold production (Phase 1 in green) and AISC life of mine.
To view an enhanced version of Figure 3, please visit:
https://orders.newsfilecorp.com/files/4509/98543_fig3.png
Mineral Resource Estimate
This mineral resource estimate updates and replaces the last estimate that was published in a Company press release dated March 16, 2021.
Geological model
In order to create a geological model that represents the Castelo de Sonhos Paleoplacer deposit. Tristar, with the help of GoldSpot Discoveries, identified across the entire plateau, 15 litho-geochemical units were interpreted and rendered as wire-framed solids. Some of these are sedimentary units that run sub-parallel to the bowl-shaped stratigraphy of the plateau's meta-sediments. Others do not run parallel to the general bedding direction; instead, they are non-sedimentary rocks that cut across the stratigraphy. These were grouped into seven domains, separated by two erosional unconformities.
Block model
The resource block model uses 20×20×4m blocks, the horizontal dimension of the blocks is slightly less than half of the 50m drill spacing. The block height is the same as the bench height chosen for the PEA completed in 2018.
In each block, the volumetric contribution of the seven domains was calculated directly from the litho-geochemical wireframes and the erosional unconformities. Approximately half of the blocks lie entirely inside a single domain; the other half have a mixture of two or more domains.
All rock in the resource model is assumed to have a dry bulk density of 2.68 t/m3, the average of the density measurements done on drill core in 2018.
For each domain that contributes to a block, Multiple Indicator Kriging (MIK) was used to estimate the gold grade distribution of its selective mining units (SMUs) using nearby samples from the same domain, with the SMU size based on planned equipment size, bench height, blast hole spacing, and on the experience of the operating mine at Tarkwa, in the same type of paleo-placer gold deposit. A 200×200×25m search ellipsoid was used for the MIK estimates for every domain in every block, aligned with the variogram model for the dominant domain.
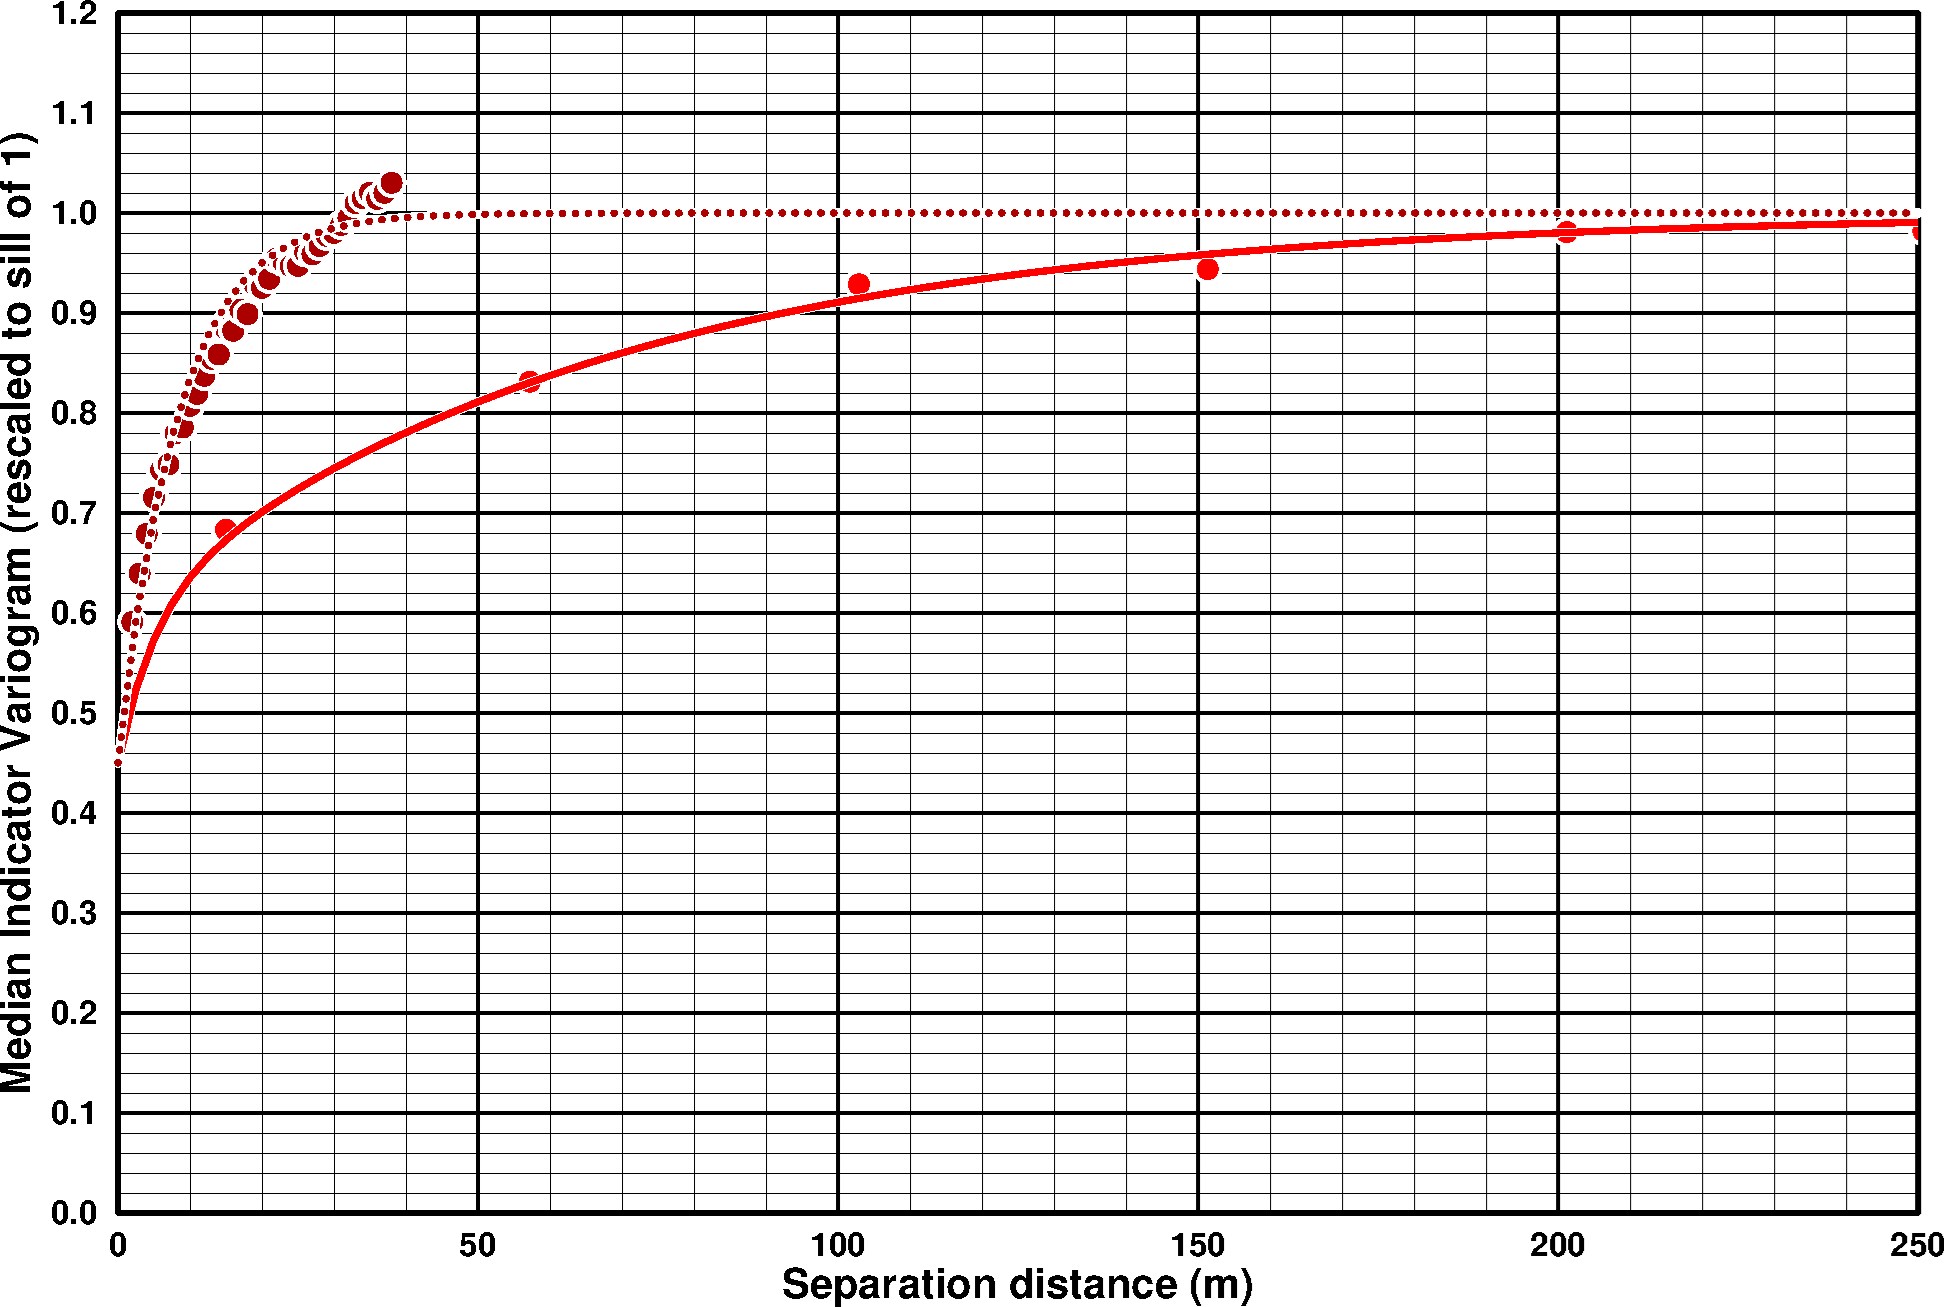
Figure 4, Median indicator variography for the ferrous sediments, with the red line showing the omnidirectional variogram in the bedding plane and the dotted dark red line showing the variogram perpendicular to bedding.
To view an enhanced version of Figure 4, please visit:
https://orders.newsfilecorp.com/files/4509/98543_2c81fd6e0417dbf3_005full.jpg
Resource Classification
Resource classification involved two steps: 1) conditional simulation of gold grades so that the uncertainty on annual gold production could be evaluated; and, 2) development of an optimal pit shell to ensure that reported resources could be reached by an open pit operation using realistic assumptions for technical and economic parameters. 100 conditional simulations were created, ranked according to the gold metal content within a flat ellipsoid centered on each block, with the ellipsoid set to a size that captured one year of ore production at a rate of 10,000 tpd. If the 90% confidence interval for the local distribution of gold metal content was less than ±15% of the mean, the block was classified as Indicated. Blocks where this degree of certainty could not be achieved were classified as Inferred; because of the search strategy used for grade estimation, blocks that do not have drill hole data within the range of the variogram were not classified and do not contribute to the resource estimate. No blocks were classified as Measured. Once the blocks had been classified using conditional simulation, a reporting pit shell was developed using Whittle software, using all of the economic and technical parameters that were used to calculate reserves, except for the gold price, which was set to a value slightly below the high of the past decade, an intentionally optimistic assumption designed to ensure that the reporting pit shell includes any resources that have reasonable prospects for economic extraction by open pit methods during the coming decade. Blocks outside the reporting pit shell were removed from the classified resource inventory. Results are shown in Table 2 below.
| Region | Classification | Tonnage (Mt) | Grade (g/t Au) | Metal Content (Moz Au) |
| Esperança South | Indicated | 29.0 | 1.3 | 1.2 |
| Inferred | 10.0 | 1.2 | 0.4 | |
| Esperança East | Indicated | 5.0 | 0.8 | 0.1 |
| Inferred | 12.8 | 0.7 | 0.3 | |
| Esperança Center | Indicated | 19.1 | 0.7 | 0.4 |
| Inferred | 3.3 | 0.9 | 0.1 | |
| Project Total | Indicated | 53.1 | 1.0 | 1.8 |
| Inferred | 26.0 | 0.9 | 0.7 |
Table 2, Mineral resource estimate1 for the Castelo de Sonhos gold project (with an effective date of October 4, 2021) above a reporting cutoff grade of 0.26 g/t Au. The Qualified Person is Leonardo de Moraes Soares MAIG of GE21.
1Project totals may appear not to sum correctly since all numbers have been rounded to reflect the precision of Inferred and Indicated mineral resource estimates.
2The reporting cutoff corresponds to the marginal cutoff grade for an open pit with processing + G&A cost of $US 12/t, metallurgical recovery of 98% and a gold price of $US 1,550/oz. To meet the requirement of "reasonable prospect for eventual economic extraction" the mineral resources must also fall within a bounding pit shell with 55° walls. These are mineral resources and not reserves and as such do not have demonstrated economic viability.
3The metal content estimates reflect gold in situ, and do not include factors such as external dilution, mining losses and process recovery losses.
4TriStar is not aware of any environmental, permitting, legal, title, taxation, socio-economic, marketing or political factors that might materially affect these mineral resource estimates.
Mineral Reserve Estimate
The Mineral Reserves for Castelo de Sonhos are a subset of the Indicated Mineral Resources as described above, as none of the mineral resources were classified in the Measured Category there are no Proven Reserves. Probable Mineral Reserves are modified from Indicated Mineral Resources and are summarized in Table 3. Inferred Mineral Resources are set to waste.
| Region | Classification | Tonnage (Mt) | Grade (g/t Au) | Metal Content |
| (Moz Au) | ||||
| Esperança South | Probable | 24.2 | 1.28 | 0.99 |
| Esperança East | Probable | 3.1 | 0.82 | 0.08 |
| Esperança Center | Probable | 11.4 | 0.78 | 0.29 |
| Project Total | Probable | 38.7 | 1.1 | 1.4 |
Table 3, Mineral reserves for Castelo de Sonhos
The Mineral Reserve estimates were prepared by Guilherme Gomides Ferreira MAIG of GE21 , and have an effective date of October 4, 2021.
Mineral Reserves are reported using the 2014 CIM Definition Standards and are estimated in accordance with the 2019 CIM Best Practices Guidelines. Mineral Reserves are based on the PFS LOM plan.
Mineral Reserves are mined tonnes and grade; and includes consideration for modifying factors such as loss and dilution.
Mineral Reserves are reported at a cut-off of 0.26 g/t gold. The cut-off grade covers processing costs of $9.99/t, general and administrative ("G&A") costs of $2.00/t, a gold price of US$1,550/oz. and uses a 98% metallurgical recovery for gold.
Numbers have been rounded as required by reporting guidelines. There are no other known factors or issues that materially affect the Mineral Reserve estimate other than which is disclosed above, and normal risks faced by mining projects in the jurisdiction in terms of environmental, permitting, taxation, socio-economic, marketing, and political factors and additional risk factors as listed in the "Cautionary Note Regarding Forward-Looking Information" section below.
Project Description
The Castelo de Sonhos operation will include an open pit gold mine and processing facilities with a nominal milling rate of 10,000 tpd (3.6Mtpa).
Power will be supplied by a 17 km, 138 kV transmission line from a substation adjacent to Highway 163 near the town of Castelo de Sonhos.
At closure, all buildings will be removed, disturbed lands rehabilitated, and the property returned to otherwise functional use according to future approved reclamation plans and accepted practices at the time of closure.
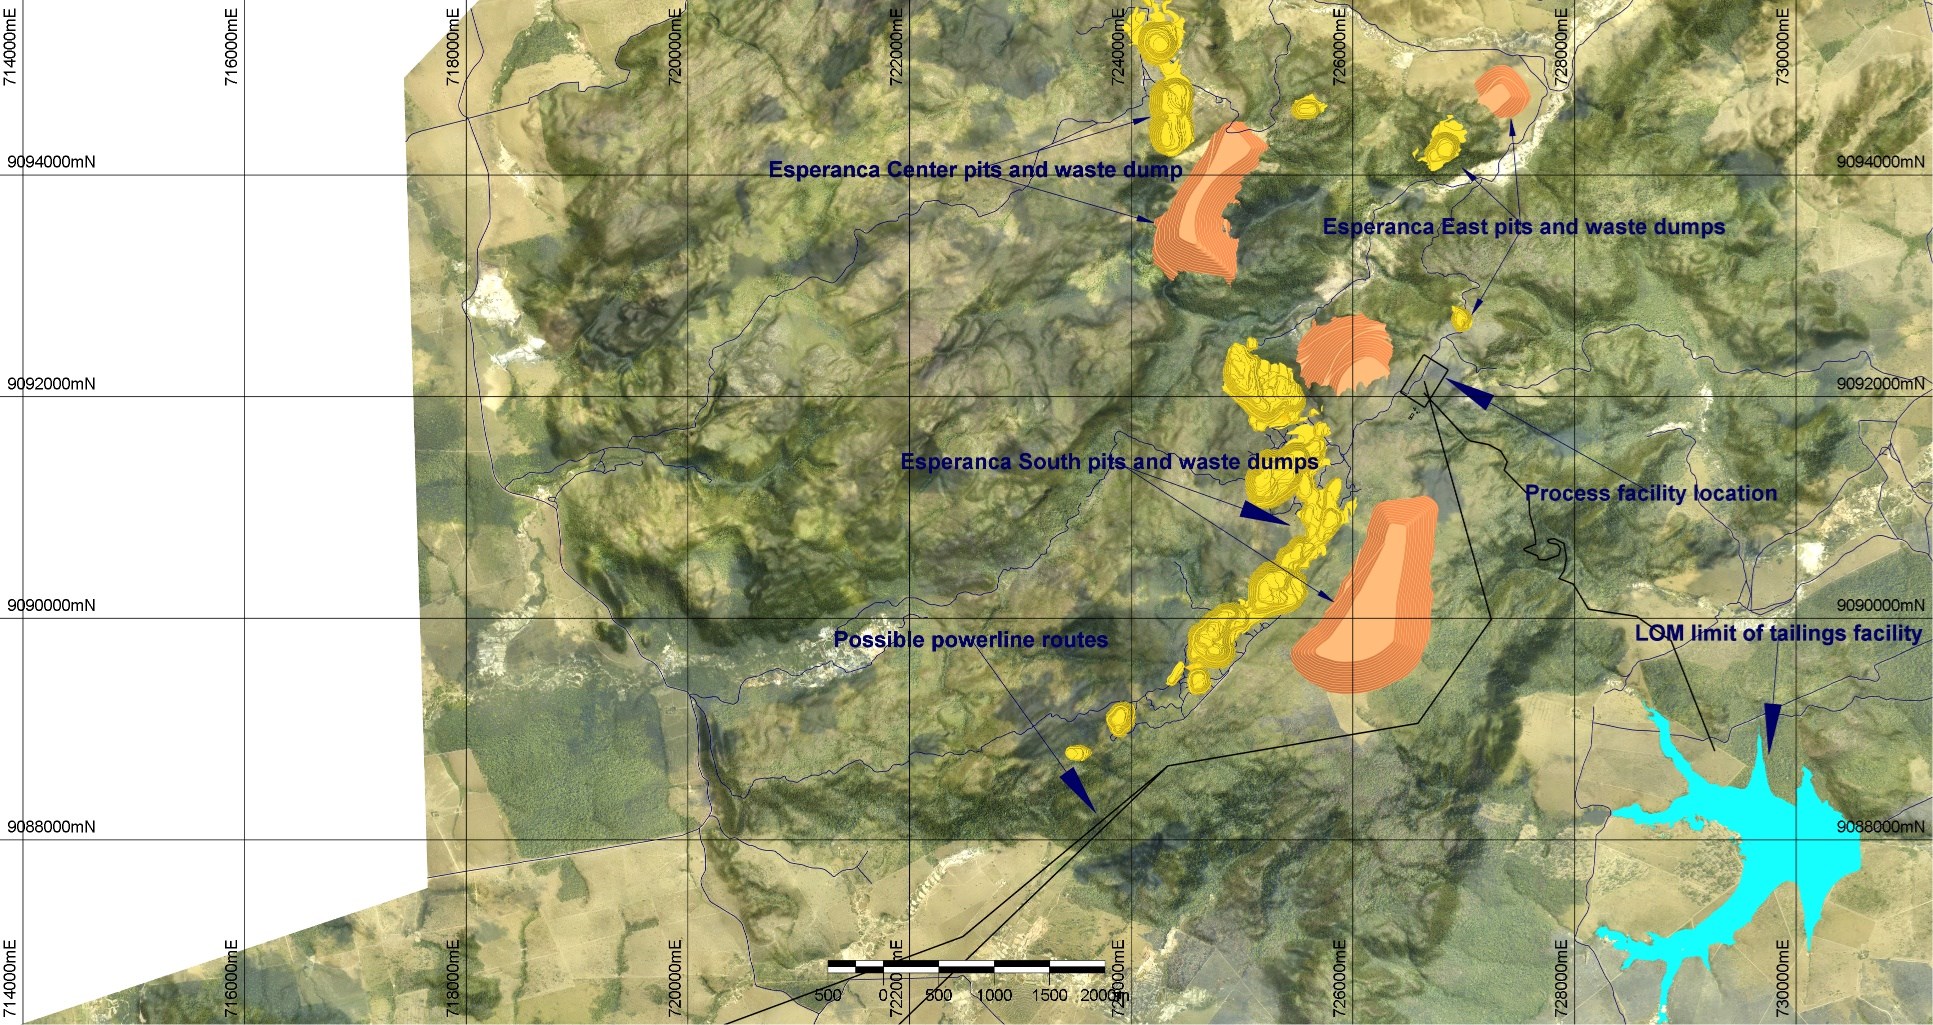
Figure 5, Castelo de Sonhos project prefeasibility proposed layout.
To view an enhanced version of Figure 5, please visit:
https://orders.newsfilecorp.com/files/4509/98543_2c81fd6e0417dbf3_006full.jpg
Mining
Mining will be based on conventional open pit methods (drill-blast-load-haul), which are suited to the Project location, orebody and local site conditions.
Open pit operations are anticipated to run for 11 years including Phase 1 (Esperança South) for the first 6 years of operation, and Phase 2 (Esperança East and Esperança Center) for years 7 through 11. The anticipated production rate is 3.6Mt of ore per year with a life-of-mine strip ratio of 9 : 1.
Owner-operated mining and fleet maintenance operations are planned for 365 days/year, with 3 8-hour shifts planned per day with 4 operating teams. Initially, mining will be undertaken using 4.5m3 bucket hydraulic excavators and 42t payload haul trucks, with blasting of ore and waste.

Figure 6, Annual summary of tonnes mined and gold head grade.
To view an enhanced version of Figure 6, please visit:
https://orders.newsfilecorp.com/files/4509/98543_fig6.png
Metallurgy & Process
Process Flowsheet
Whole ore agitation leaching has been selected as the preferred process flowsheet for project development. The plant will be designed to treat 10,000 tpd through crushing, grinding, hybrid cyanidation and carbon in leach, carbon acid wash, pressure stripping, and thermal regeneration. Electrowinning sludge will be dried and smelted to produce doré bars for shipment to third party refiners. Based on the test work conducted this flowsheet is anticipated to result in a metallurgical recovery of 98% of the gold delivered to the plant.
Process Plant Operations
A run of mine stockpile area and the primary crusher dump hopper will be located adjacent to the Esperança south pit rim close to the centroid of the deposit. ROM will be hauled from the pit and either stockpiled for blending and/or subsequent reclamation by front end loader or direct dumped over a 400mm square opening stationary grizzly into the primary dump hopper, with a nominal capacity of 150 tonnes. Sonic fogger dust suppression will be provided above the hopper. A rock pick mounted on the hopper will handle grizzly oversize. Material will be withdrawn from the dump hopper with a vibrating grizzly feeder (1.6 x 3.7m with 150mm grizzly bar openings). Grizzly undersize will bypass the primary crusher, oversize feeds the primary crusher (1.25 x 0.95m jaw, set at 150mm).
Combined grizzly undersize and crusher discharge will be conveyed to a conical, uncovered, 40,000 tonnes total capacity coarse pile (live capacity nominally 10,000 tonnes, equal to one day's production). Material will be reclaimed by two vibrating grizzly feeders (1.6 x 3.7m with 150mm grizzly bar openings) located in a tunnel beneath the pile.
The grinding circuit consists of an 8.5m diameter, 3.65m long (28 x 12 ft) fixed speed, 3,750 kilowatt semi autogenous (SAG) mill operating in closed circuit with a 200 kilowatt pebble crusher and (primary) cyclones followed by a 5.5m diameter, 7.5m long (18 x 25ft) fixed speed, 3,750 kilowatt, ball mill operating in closed circuit with (secondary) cyclones. Lime and sodium cyanide will be added to the SAG mill feed belt.
Combined primary and secondary cyclone overflows with P80 of 105 microns (150 mesh) in a slurry containing 40% w/w solids, pass through vibrating trash screens which discharge to the first of ten, 15.9m diameter x 16.8m high (52 x 55ft) cyanidation/CIL tanks operating in series for a total retention time of 36 hours. Air will be injected into the first three leach tanks to promote gold dissolution and sodium cyanide solution is added to maintain a concentration of 1gpl in leaching. The last five (CIL) tanks contain 10gpl activated carbon. Intertank screens retain carbon in the CIL tanks, carbon will be advanced through the circuit periodically by pumping slurry countercurrent to the normal slurry flow. Carbon remains in the recipient tank and slurry flows back downstream
Loaded carbon containing nominally 2,000g (65ozs) of gold per tonne will be pumped out of the first CIL tank, discharged over a wash screen and advanced at the rate of eight tonnes per day to acid washing followed by elution in a pressure stripping system. Stripped carbon will be thermally regenerated in a gas fired rotary kiln operating at 1,200oF and returned to the fifth CIL tank.
Gold will be electrowon from loaded eluate in three, 750amp cells operating in parallel. Metal deposited on stainless steel wool cathodes will be rinsed off decanted and collected as "sludge" which will be dried and smelted to produce doré bars.
Leached slurry discharged from the last CIL tank passes through safety screens to recover carbon fines and flows by gravity to the tailings wash thickener where it is diluted with water reclaimed from the tailings pond. Thickener overflow is returned to the grinding circuit. Thickener underflow is pumped to cyanide destruction, mixed with sodium metabisulfite, copper sulfate and lime and subjected to intense agitation with low pressure air to destroy residual cyanide down to approximately 1ppm weak acid dissociable ("WAD") cyanide.
Cyanide destruction circuit effluent will be pumped to the tailings dam constructed approximately 6kms from the plant. It is proposed to construct the TSF in two phases, Phase 1 and Phase 2, corresponding to embankment crest elevation 281 m and 290 m above sea level. The embankment will be raised utilizing the downstream construction method with slopes angles 1V:3H upstream and downstream. From the lowest main embankment elevation of 265 m above sea level, resulting in an ultimate embankment height of approximately 26m above natural ground level.
Process water will be reclaimed with barge mounted pumps in the pond and returned to the process water storage tank at the plantsite. Expansion in Phase two of the dam will be by downstream construction methods to international standards.
For the purposes of this study, it has been assumed that freshwater will be sourced from a well field close to the plantsite. It may be necessary to change to a catchment dam across one of the drainages on site to store precipitation run-off for this purpose.
Economic Results
The results of the PFS are shown below in Table 4. A base case gold price of $1,550 has been used and a fixed exchange ratio of BRL5 (5 Brazilian Reals) to US$1.
| Parameter | Unit | Pre-tax | Post-tax |
| Cash flow | US$ millions | 635 | 524 |
| IRR | % | 33 | 28 |
| NPV 5% | US$ millions | 399 | 321 |
| NPV 7% | US$ millions | 332 | 263 |
| Cash Cost | US$/oz | 877 | |
| AISC | US$/oz | 900 | |
| Initial Capital | US$ millions | 261 | |
| Life of mine production | Moz gold | 1.3 | |
| Average annual production | oz gold | 121,000 | |
| Payback period (Mine life) | Years | 2.8 | |
Table 4, Summary of economic results of the PFS.
Notes: Estimated All In Sustaining Costs per ounce of gold produced is a Non-GAAP measure that is equal to the total of site mining costs, site and corporate G&A costs, royalties and production taxes, realized gains/losses on hedging transactions, community and permitting costs relating to current operations, refining costs, site based non-cash remuneration, inventory write-downs, stripping costs, byproduct credits, reclamation costs, and sustaining costs related to exploration and studies, capital exploration, capitalized stripping and underground mine development, and capital expenditures, divided by the estimated total ounces of gold produced during the life of the mine. Cash costs per ounce of gold produced is also a non-GAAP financial measure and is equal to on-site mining and processing costs, on-site general and administration costs, realized gains and losses on hedges due to operating costs, community and permitting costs related to current operations, third party refining and transportation costs, non-cash site remuneration costs, stripping costs, stockpile and inventory write-downs, exploration costs related to current operations and by-product credits all divided by ounces of gold cost produced.
Capital Cost Estimate
The Study outlines an initial capital cost estimate of US$261 million, including a 20% contingency.
Table 5 below summarizes the initial capital cost estimate for the Project.
| DESCRIPTION | US$ MILLIONS | |
| Mine | 31.4 | |
| Power transmission line | 10.4 | |
| Plant | 166.0 | |
| Tailings storage facility | 9.6 | |
| Contingency (20%) | 43.5 | |
| Total | 260.9 | |
Table 6, Summary of major components of initial capital estimate.
Operating Costs
Operating costs by phase for the LOM are provided in Table 6 below.
| Parameter | Unit | |
| Process rate | t/day | 10,000 |
| Average head grade | g/t | 1.1 |
| Phase 1 head grade | g/t | 1.3 |
| Phase 2 head grade | g/t | 0.8 |
| Gold Recovery | % | 98 |
| Mine operating cost (owner operator) | US$/t moved | 1.66 |
| Process operating cost | US$/t processed | 8.99 |
| G&A | US$/ processed | 1.63 |
| LOM strip ratio | Waste t : process t | 9 : 1 |
Table 7, Life of mine summary of operating parameters and costs
Additional Opportunities and Next Steps
Study results particularly highlight the economic strength of Phase 1 (Esperança South) in the two-phased development approach at CDS. Based on successful and continuous resource growth over the last five years and on exploration advancements in partnership with Goldspot Discovery via their machine learning process, management is confident that further exploration drill programs have the potential to expand higher grade resources. These resources may extend Phase 1 production, displacing Phase 2 production to later years in the Project's overall mine plan. Permitting activities are underway to advance the project to production. Both exploration and permitting activities can be conducted in parallel to enhance project advancement. Strategic planning is ongoing to maximize the Project's value to the Company.
Qualified Person
Porfirio Cabaleiro Rodriguez (MAIG #3708), Director of GE21, is the Qualified Person, as defined by National Instrument 43-101 - Standards of Disclosure for Mineral Projects, for the Preliminary Feasibility Study presented in this press release, is independent of the Company and has approved the technical disclosure in this press release.
About TriStar
TriStar Gold is an exploration and development company focused on precious metals properties in the Americas that have the potential to become significant producing mines. The Company's current flagship property is Castelo de Sonhos in Pará State, Brazil. The Company's shares trade on the TSX Venture Exchange under the symbol TSG and on the OTCQX under the symbol TSGZF. Further information is available at www.tristargold.com.
On behalf of the board of directors of the company:
Nick Appleyard
President and CEO
For further information, please contact:
TriStar Gold Inc.
Nick Appleyard
President and CEO
480-794-1244
moc.dlogratsirt@ofni
Neither the TSX Venture Exchange nor its Regulation Services Provider (as that term is defined in the policies of the TSX Venture Exchange) accepts responsibility for the adequacy or accuracy of this release. No stock exchange, securities commission or other regulatory authority has approved or disapproved the information contained herein.
Forward-Looking Statements
Certain statements contained in this press release may constitute forward-looking statements under Canadian securities legislation which are not historical facts and are made pursuant to the "safe harbour" provisions under the United States Private Securities Litigation Reform Act of 1995. Generally, forward-looking information can be identified by the use of forward-looking terminology such as "expects" or "it is expected", or variations of such words and phrases or statements that certain actions, events or results "will" occur. Forward looking statements in this press release include all estimates from the PFS such as the cash flow, IRR, NPVs, cash cost, AISC, initial capital, life of mine production, average annual production and payback period time. Such forward-looking statements are based upon the Company's reasonable expectations and business plan at the date hereof, which are subject to change depending on economic, political and competitive circumstances and contingencies. Readers are cautioned that such forward-looking statements involve known and unknown risks, uncertainties and other factors that may cause a change in such assumptions and the actual outcomes and estimates to be materially different from those estimated or anticipated future results, achievements or position expressed or implied by those forward-looking statements. Risks, uncertainties and other factors that could cause the Company's plans to change include changes in demand for and price of gold and other commodities (such as fuel and electricity) and currencies; changes or disruptions in the securities markets; legislative, political or economic developments in Brazil; the need to obtain permits and comply with laws and regulations and other regulatory requirements; the possibility that actual results of work may differ from projections/expectations or may not realize the perceived potential of the Company's projects; risks of accidents, equipment breakdowns and labour disputes or other unanticipated difficulties or interruptions; the possibility of cost overruns or unanticipated expenses in development programs; operating or technical difficulties in connection with exploration, mining or development activities; the speculative nature of gold exploration and development, including the risks of diminishing quantities of grades of reserves and resources; and the risks involved in the exploration, development and mining business. Although management of the Company has attempted to identify important factors that could cause actual results to differ materially from those contained in forward-looking statements or forward-looking information, there may be other factors that cause results not to be as anticipated, estimated or intended. The Company disclaims any intention or obligation to update or revise any forward-looking statements whether as a result of new information, future events or otherwise, except as required by applicable securities laws.
![]()
To view the source version of this press release, please visit https://www.newsfilecorp.com/release/98543